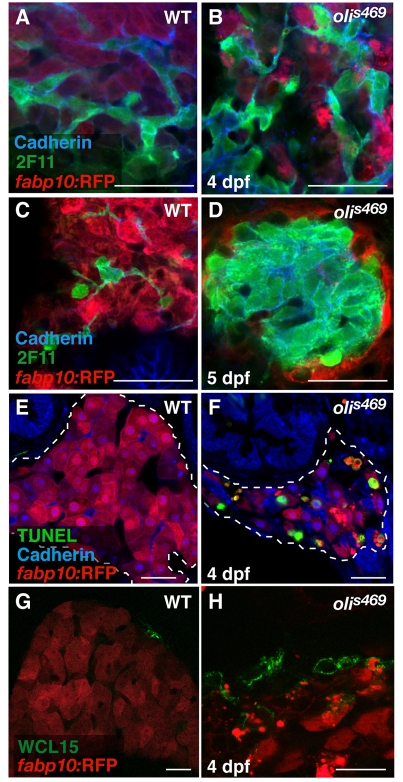
Fig. 2.
The oliver mutant phenotype is caused by hepatocyte apoptosis. (A–D) Confocal images of 4-dpf (A,B) and 5-dpf (C,D) Tg(fabp10:RFP)gz12 WT (A,C) and olis469 mutant (B,D) livers stained for cadherin (blue) and 2F11 (green). At 4 dpf, both WT and olis469 mutant livers exhibit a distinct intrahepatic biliary tree (highlighted by the expression of cadherin and 2F11), intercalated by hepatocytes (red). However, 24 hours later (5 dpf), the biliary tree in olis469 mutants has turned into a dense cellular mass. (E,F) Confocal images of transverse sections of 4-dpf Tg(fabp10:RFP)gz12WT (E) and olis469 mutant (F) livers stained for cadherin (blue) and TUNEL (green); the livers are outlined by dashed lines. At 4 dpf, a large number of hepatocytes (red) undergo apoptosis in olis469 mutant livers (F), whereas no TUNEL staining can be detected in the livers of their WT siblings (E). (G,H) Confocal images of 4-dpf Tg(fabp10:RFP)gz12WT (G) and olis469 mutant (H) livers stained with the macrophage antibody WCL15 (green). As hepatocytes (red) undergo apoptosis in olis469 mutant livers, multiple macrophages (green) can be detected engulfing them (H), whereas in their WT siblings, macrophages can only very occasionally be detected in the periphery of the liver (G). Bars, 20 μm.

