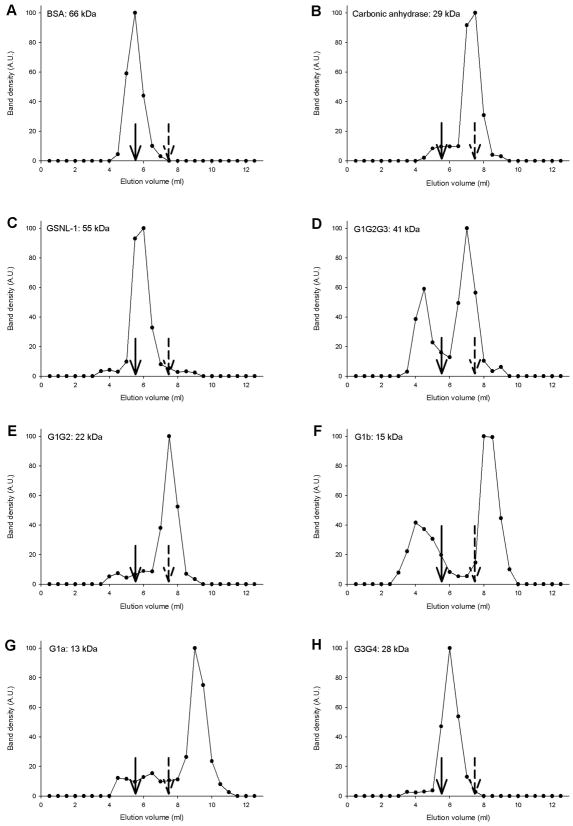
Figure 5.
Estimation of native molecular mass of GSNL-1 variants by gel filtration chromatography. Bovine serum albumin (BSA) (A), carbonic anhydrase (CA) (B), GSNL-1 (C), G1G2G3 (D), G1G2 (E), G1b (F), G1a (G), or G3G4 (H) was applied to a Superdex 75 gel filtration column (24 ml bed) and eluted with F-buffer containing 0.1 mM CaCl2. The eluates were fractionated every 0.5 ml, and eluted proteins analyzed by SDS-PAGE and Coomassie blue staining. Density of the protein bands (arbitrary units) is plotted as a function of elution volume (ml). Arrows with solid lines and broken lines indicate peak positions of BSA (66 kDa) and CA (29 kDa), respectively. Molecular masses shown in the figure are calculated values for monomers.

