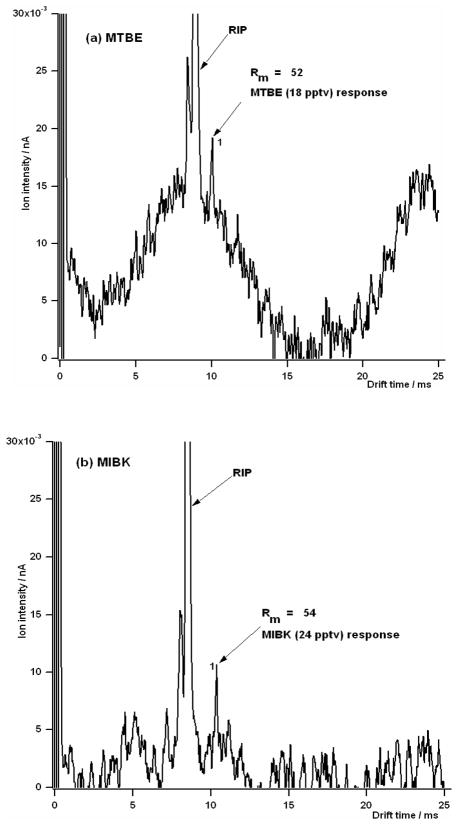
Figure 8.
Ion mobility spectra of the minimum detectable amount at the optimum voltage and gate pulse width of 100 μs for (a) MTBE, and (b) MIBK. The reduced mobility value for peak 1 in (a) and (b) were 1.91 and 1.77 cm2 V−1 s−1, respectively, indicating that they were the monomer ions of both MTBE and MIBK.

