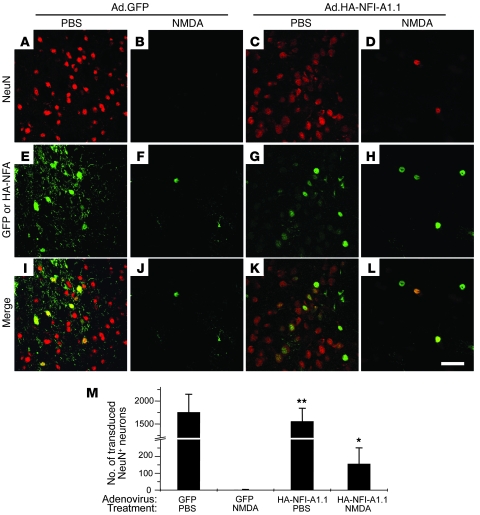
Figure 5. Delivery of NFI-A adenovirus into striatum followed by NMDA microinjection.
(A, B, E, F, I, and J) Ad.GFP or (C, D, G, H, K, and L) Ad.HA-NFI-A1.1 at 108 PFU was injected into mouse striatum. Three days after virus injection, the mice were subjected to a second microinjection of 0.3 ml PBS (A, C, E, G, I, and K) or 0.3 μl 50 mM NMDA (B, D, F, H, J, and L) into the same site as the original virus injection site. Two days afterward, 40-μM brain sections through the striatum were prepared and labeled with antibodies to NeuN, HA, or GFP. Scale bar: 50 μm. (M) Quantification of surviving neurons. In the striatum, the boundaries of the lesion area are clearly identified by observing the boundaries of NeuN staining. Every section through the lesion was analyzed, and GFP/NeuN double-positive or HA/NeuN double-positive cells were counted and quantified. For each group, n = 4. *P < 0.01, 1-way ANOVA followed by Tukey-Kramer post-hoc test, compared with GFP/NMDA-treated animals. **Not significantly different compared with GFP/PBS-treated animals.

