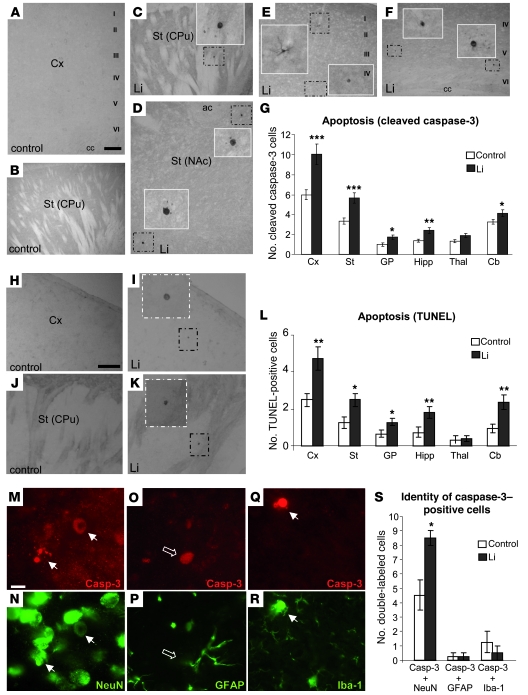
Figure 2. Neuronal apoptosis induced by chronic lithium administration.
(A–F) Immunohistochemical detection of cleaved caspase-3–positive cells in cortex (A, E, and F) and striatum (B, C, and D) of control (A and B) and lithium-treated (C–F) mice. Insets show higher magnifications of the boxed areas. I–VI, layers of the cortex; cc, corpus callosum; CPu, caudate putamen; NAc, nucleus accumbens; ac, anterior commissure. Scale bar in A: 200 μm (A–F). (G) Immunohistochemical quantification of the number of cleaved caspase-3–positive cells per 30-μm sagittal section in regions analyzed (n = 22 per group, 4 sections per animal). GP, globus pallidus; Hipp, hippocampus; Thal, thalamus; Cb, cerebellum. (H–K) Representative images of TUNEL staining in cortex (H–I) and striatum (J and K) of control (H and J) and lithium-treated (I and K) mice. Scale bar in H: 200 μm (H–K). (L) Quantification of the number of TUNEL-positive cells per 30-μm sagittal section in the different regions analyzed (control, n = 12; lithium, n = 10). (M–R) Representative images of double-labeling immunofluorescence with anti–cleaved caspase-3 and anti-NeuN (M and N), GFAP (O and P), or Iba-1 (Q and R) antibodies in striatal sections of lithium-treated mice. Scale bar in M: 10 μm (M–R). White arrows indicate double-labeled cells; open arrows, caspase-3–positive/GFAP-negative cells. (S) Histogram showing quantification of double staining with caspase-3 antibody (Casp-3) and markers of different cellular types (n = 8 per group). *P < 0.05, **P < 0.01, ***P < 0.001.

