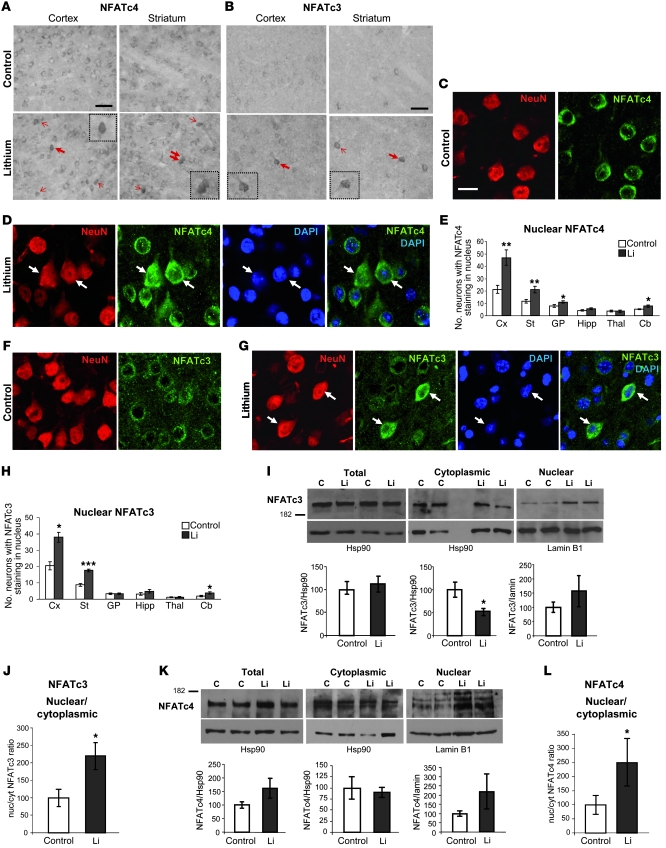
Figure 3. Increased nuclear localization of NFAT transcription factors in lithium-treated mice.
(A) Representative images of NFATc4 immunohistochemistry in cortex and striatum of control and lithium-treated mice. Arrows indicate neurons with NFATc4 staining in the nucleus. (B) Representative images of NFATc3 immunohistochemistry in cortex and striatum of control and lithium-treated mice. Arrows indicate neurons with NFATc3 staining in the nucleus. Insets show higher magnifications of the cells marked with bold arrows. Scale bars in A and B: 100 μm. (C and D) Representative confocal microscope images showing a 1-μm-deep cortical area subjected to double immunofluorescence with NFATc4 antibody and NeuN antibody (to confirm neuronal identity) and DAPI counterstaining (to verify the nuclear localization) in control (C) and lithium-treated (D) mice. (E) Number of neurons exhibiting NFATc4 staining in the nucleus per section in regions analyzed (n = 8 per group). (F and G) Representative images of double immunofluorescence with NFATc3 and NeuN antibodies combined with DAPI nuclear counterstaining in cortex of control (F) and lithium-treated (G) mice. Scale bar: 15 μm (C–G). (H) Number of neurons exhibiting NFATc3 staining in the nucleus per section in regions analyzed (n = 8 per group). (I and K) Western blot detection of NFATc3 (I) and NAFTc4 (K) in total, cytoplasmic, and nuclear homogenates from cortex of control and lithium-treated mice (n = 12 per group). Hsp90 (total and cytoplasmic) and lamin B1 (nuclear) antibodies were assayed as loading control. Histograms represent quantification of total, cytoplasmic, and nuclear NFATc3 and NFATc4 corrected by the loading control. (J and L) Nuclear/cytoplasmic (nuc/cyt) ratio of NFATc3 (J) and NFATc4 (L). All histograms in I–L represent lithium values as a percentage compared with the control group. *P < 0.05, **P < 0.01, ***P < 0.001.

