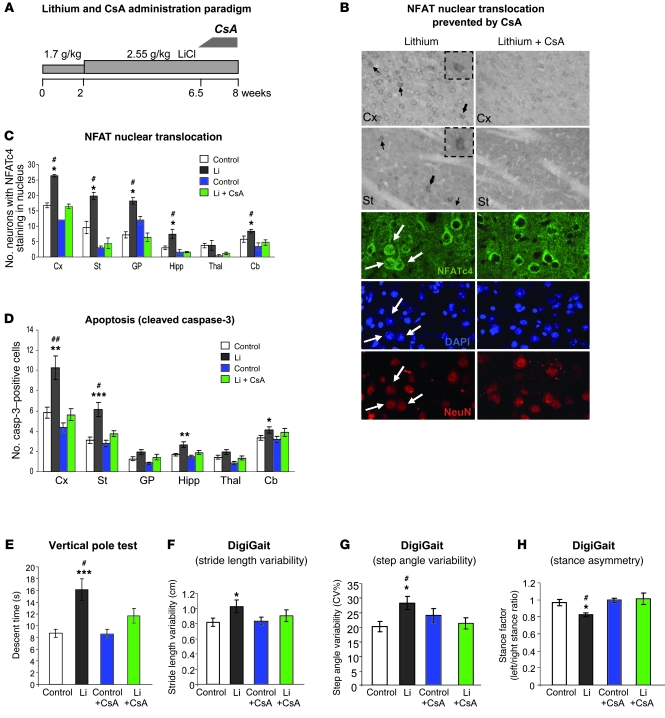
Figure 5. CsA administration impedes NFAT nuclear translocation and prevents chronic lithium-induced apoptosis and motor deficits.
(A) Diagram showing lithium and CsA administration protocol in mice. (B) Immunohistological detection of NFATc4. Upper panels show representative immunohistochemistry images in cortex and striatum. Lower panels show confocal microscope images (1 μm) of double immunofluorescence with NeuN together with DAPI nuclear counterstaining in cortex. Left and right panels correspond to lithium- and lithium plus CsA–treated mice, respectively. Arrows indicate neurons with NFATc4 staining in the nucleus, and insets in the upper panels show higher magnifications of the cells marked by bold arrows. Scale bars: 100 μm (upper panels) and 15 μm (lower panels). (C) Number of neurons exhibiting NFATc4 staining in the nucleus per section in regions analyzed (n = 4 per group). (D) Number of cleaved caspase-3–positive cells per 30-μm sagittal section in regions analyzed (control, n = 19; lithium, n = 19; control + CsA, n = 12; lithium + CsA, n = 12). (E) Descent time in vertical pole test (control, n = 20; lithium, n = 17; control + CsA, n = 19; lithium + CsA, n = 20). (F–H) Gait analysis. Stride length variability (F), step angle variability (G), and stance asymmetry (H) in footprint test as measured by DigiGait system (control, n = 15; lithium, n = 12; control + CsA, n = 16; lithium + CsA, n = 16). *P < 0.05, **P < 0.01, ***P < 0.001 versus control; #P < 0.05 versus lithium + CsA.

