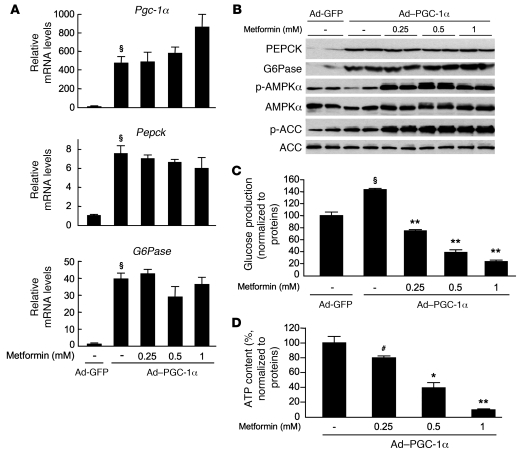
Figure 9. Forced expression of gluconeogenic genes does not prevent the metformin-induced inhibition of hepatic glucose production.
After attachment, WT primary hepatocytes were infected with 25 PFU/cell of Ad-GFP or Ad–PGC-1α adenovirus and cultured for 16 hours in M199 medium containing 100 nM dex. Hepatocytes were then incubated in glucose-free DMEM containing lactate/pyruvate (10:1 mM) and 100 nM dex alone or with 0.25, 0.5, or 1 mM metformin. After 8 hours, medium was collected for glucose measurement and cells were harvested for Western blot and gluconeogenic gene expression analyses and ATP content determination. (A) Relative mRNA levels of Pgc-1α, Pepck, and G6Pase expressed as fold activation relative to levels in Ad-GFP–infected hepatocytes. Results represent 3 independent experiments. §P < 0.001 compared with Ad-GFP–infected hepatocytes. (B) Immunoblots were performed against PEPCK, G6Pase, phospho-AMPKα (Thr172), AMPKα, phospho-ACC (Ser79), and ACC. Blots represent of 3 independent experiments. (C) Glucose production and (D) ATP intracellular content were normalized to protein content and expressed as a percentage of that produced by Ad-GFP– or Ad-PGC-1α–infected hepatocytes incubated in the absence of metformin. Results represent 5 independent experiments. §P < 0.01 compared with Ad-GFP–infected hepatocytes; #P < 0.05, *P < 0.01, **P < 0.001 compared with Ad–PGC-1α–infected hepatocytes incubated in the absence of metformin. Data are mean ± SEM.

