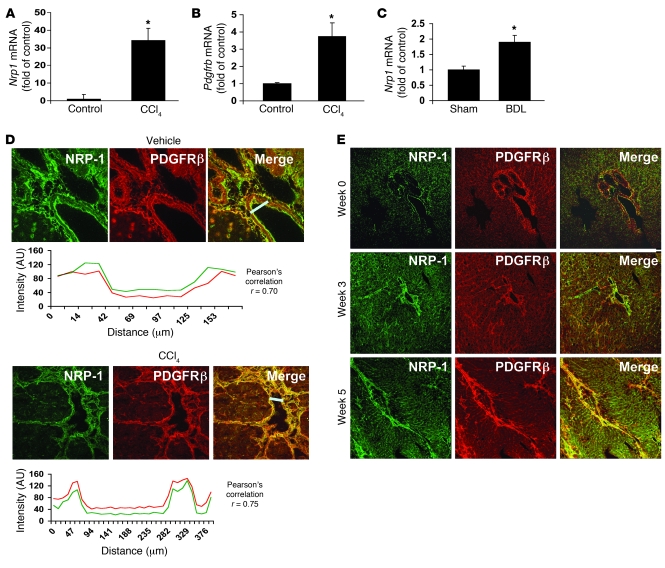
Figure 1. NRP-1 expression correlates with activation of HSCs into a motile myofibroblastic phenotype.
(A and B) Nrp1 and Pdgfrb mRNA levels in isolated rHSCs from CCl4-treated rats were increased compared with those from control rats as measured using qRT-PCR (n = 3, *P < 0.05). (C) Nrp1 mRNA levels were increased in rHSCs from BDL as compared with sham-operated rats (n = 5, *P < 0.05). (D) Five-micrometer sections of rat liver were stained with an Ab against NRP-1 (green). Liver tissues of rats treated with either vehicle or CCl4 were coimmunostained for PDGFRβ and NRP-1. Representative images for NRP-1 staining (in green) are shown in the left panels and for PDGFRβ (in red), in the middle panels; overlays of the two (in yellow) are in the right panels. Below each image is the colocalization analysis for each of the overlay images. The graph peaks represent the fluorescence intensities of the staining at the given distances (in micrometers) along the straight white bar. The white bars in the overlay images represent the area selected for colocalization. (E) Time course expression of NRP-1 in liver of CCl4-treated rats. Liver tissue of rats treated with CCl4 was sectioned at various time points and coimmunostained using NRP-1 and PDGFRβ Ab. Original magnification, ×10.

