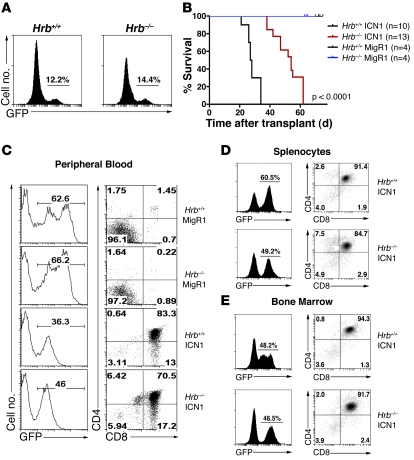
Figure 4. Hrb is required for efficient ICN1-induced leukemogenesis.
(A) Analysis of GFP expression in Hrb+/+ and Hrb–/– BM after transduction with ICN1-expressing retrovirus and before transplantation into lethally irradiated recipients. Numbers in each GFP histogram refer to the GFP-positive percentage. (B) Kaplan-Meier survival curve of mice receiving Hrb+/+ ICN1–transduced BM (n = 10), Hrb–/– ICN1–transduced BM (n = 13), Hrb+/+ MigR1–transduced BM (n = 4), and Hrb–/– MigR1–transduced BM (n = 4). Statistical significance was established using the Mantel-Cox log rank analysis and showed a significant increase in survival in mice receiving Hrb–/– ICN1–transduced BM (P < 0.0001). Median time of survival after BMT for mice receiving Hrb+/+ ICN1–transduced BM was 27.5 days. Median time of survival after BMT for mice receiving Hrb–/– ICN1–transduced BM was 54 days. Mice receiving MigR1-transduced BM did not succumb to disease. (C) GFP analysis and CD4+CD8+ surface staining of peripheral blood cells isolated 15 days after BMT from mice receiving Hrb+/+ and Hrb–/– MigR1– and ICN1–transduced BM cells. (D–E) GFP analysis and CD4+CD8+ surface staining of splenocytes (D) and BM cells (E) isolated from mice receiving Hrb+/+ and Hrb–/– ICN1–transduced BM cells. Numbers in GFP histograms refer to the percentage of GFP-positive cells. Numbers in each dot plot refer to the percentages in each quadrant.

