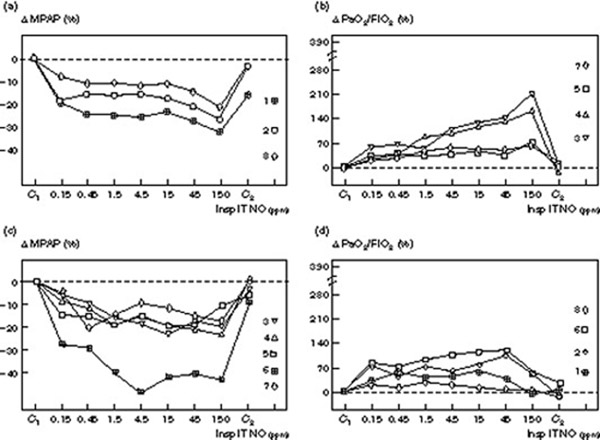
Figure 4.

Individual changes in MPAP and PaO2/FiO2 induced by increasing inspiratory intratracheal concentrations of inhaled NO (Insp IT NO) in eight patients with ARDS and without septic shock. Mean pulmonary artery pressure was measured: (1) before NO administration (C1); (2) following seven randomized concentrations of NO between 0.15 and 150 ppm, and (3) after the cessation of NO (C2). Changes are expressed as percentage variation from C1 (Δ MPAP and Δ PaO2/FiO2) and each patient is represented by a different symbol with a number corresponding to the numbers shown in Tables 1 and 2. In (a) and (b) patients without plateau effect on the dose–response curve are represented. In (c) and (d) patients with a plateau effect on the MPAP dose–response curve and showing a deterioration of their PaO2/FiO2 at the highest NO concentrations are represented.
