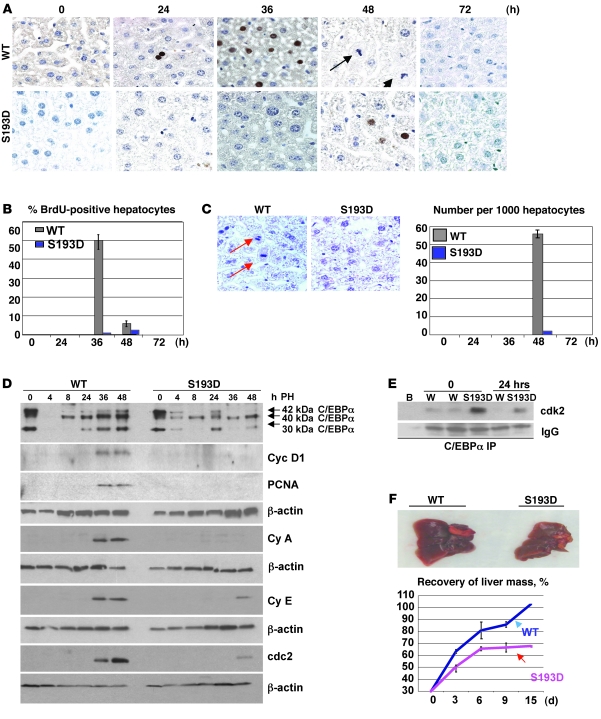
Figure 2. C/EBPα-S193D inhibits liver proliferation after PH.
(A) C/EBPα-S193D inhibits DNA synthesis after PH. BrdU staining is shown. Arrows show mitotic figures in the liver of WT mice at 48 hours after PH. Original magnification, ×63. (B) Bar graphs show the percentage of BrdU-positive hepatocytes. (C) C/EBPα-S193D inhibits mitosis. Livers were stained with H&E. Typical pictures of mitotic figures at 48 hours after PH are shown. Original magnification, ×63. Arrows show mitotic figures. Bar graph picture shows number of mitotic figures at each time point after PH. (D) Expression of C/EBPα and cell-cycle proteins after PH. Positions of C/EBPα isoforms are shown on the right. Expression of cell-cycle proteins cyclin D1 (Cyc D1), PCNA, cyclin A (Cy A), cyclin E (Cy e) and cdc2 was examined with antibodies shown on the right. Each membrane was reprobed with β-actin. (E) C/EBPα-S193D is associated with cdk2 after PH. C/EBPα was IP from nuclear extracts and the IPs were probed with Abs to cdk2. IgG, heavy chains of immunoglobulins. B, incubation of protein with beads; W, incubation of liver proteins from WT mice with C/EBPα IgGs. (F) Livers of C/EBPα-S193D mice fail to restore the original mass. 70% of the livers were removed, and the percentage of growing livers was calculated at 3, 6, 9, and 15 days after PH. Bar graphs show summary of results obtained with 3 animals of each genotype per time point. Data shown are mean ± SD.

