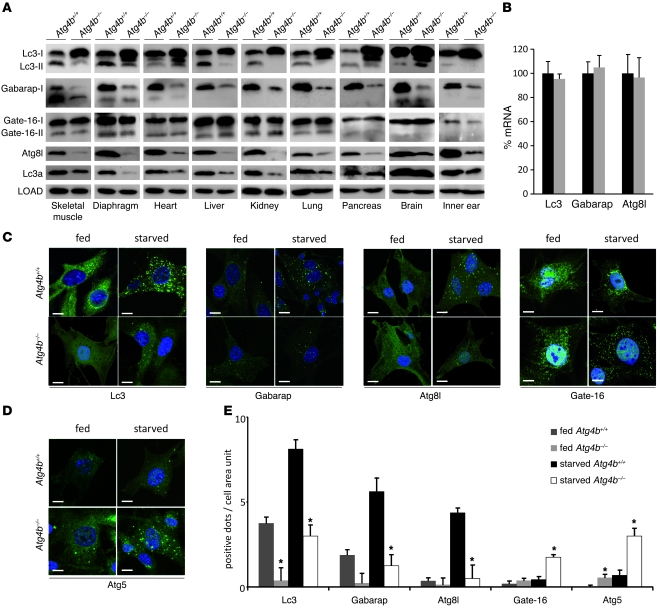
Figure 3. Analysis of Lc3, Gabarap, Gate-16, Atg8l, and Lc3a status in WT and Atg4b–/– mice.
(A) Representative immunoblots of endogenous Atg4b putative substrates. The analyzed tissues correspond to protein extracts from age-matched control and mutant mice fed ad libitum. β-Actin was used as a loading control in all tissues except heart and skeletal muscle (α-tubulin). (B) Quantitative RT-PCR analysis of Lc3, Gabarap, and Atg8l mRNA in liver, showing that the alterations in A were not due to an increase in mRNA synthesis. Transcript expression levels are relative to the expression levels detected in WT mice, which were set at 100%. Black bars, WT; gray bars, Atg4b–/–. (C) Representative immunofluorescence images of endogenous Lc3, Gabarap, Atg8l, and Gate-16 in fed and 4-hour-starved MEFs. Atg4b–/– MEFs showed a reduced number of punctate structures containing Lc3, Gabarap, or Atg8l under both fed and starved conditions. In contrast, Atg4b–/– MEFs exhibit an increase in punctate Gate-16–containing structures. (D) Representative immunofluorescence images of endogenous Atg5, showing an accumulation of immature autophagosomes in Atg4b–/– MEFs. Scale bars: 10 μm. (E) The number of endogenous Lc3, Gabarap, Atg8l, Gate-16, and Atg5 dots was counted and divided by the corresponding cellular area (μm2 × 100). Results shown represent the mean quantification values of 5 images in each depicted condition for each depicted protein. *P < 0.05 for Atg4b–/– values vs. the corresponding (fed or starved) Atg4b+/+ values.

