. 2009 Aug 28;20(4):642–658. doi: 10.1039/b904193a

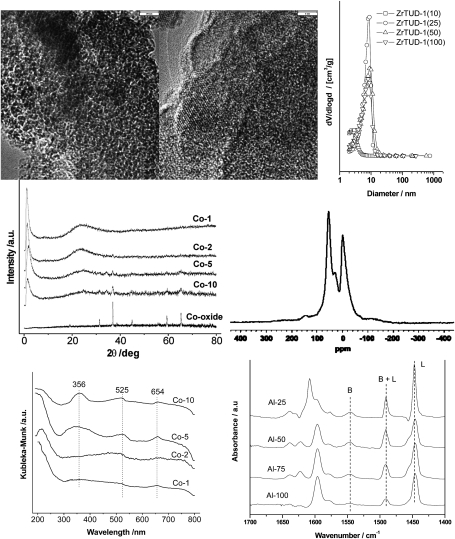
Fig. 3. Top left: HR-TEM of Zr-TUD-1 with Si/Zr = 25, the bar represents 20 nm, reproduced with permission from ref. 43. Copyright 2008, Wiley-VCH Verlag GmbH&Co. KGaA. Top middle: HR-TEM of Zr-TUD-1 with Si/Zr = 10, the bar represents 3 nm, ZrO2 crystals are visible, reproduced with permission from ref. 43. Copyright 2008, Wiley-VCH Verlag GmbH&Co. KGaA. Top right: pore size distribution of Zr-TUD-1 samples with Si/Zr ratios of 100, 50, 25 and 10 as determined by N2 adsorption and desorption isotherms, reproduced with permission from ref. 43. Copyright 2008, Wiley-VCH Verlag GmbH&Co. KGaA. Middle left: XRD patterns of Co-TUD-1 samples with Si/Co ratios of 100 (1), 50 (2), 20 (5) and 10 (10) as well as Co3O4, reproduced with permission from ref. 59. Copyright 2006, Wiley-VCH Verlag GmbH&Co. KGaA. Middle right: MAS-NMR of 27Al in Al-TUD-1 with Si/Al = 4, reproduced with permission from ref. 20. Copyright 2004, Wiley-VCH Verlag GmbH&Co. KGaA. Bottom left: UV/Vis spectra of Co-TUD-1 samples with Si/Co ratios of 100 (1), 50 (2), 20 (5) and 10 (10), reproduced with permission from ref. 59. Copyright 2006, Wiley-VCH Verlag GmbH&Co. KGaA. Bottom right: FT-IR difference spectra of Al-TUD-1 samples with Si/Al ratios of 25, 50, 75 and 100 after pyridine desorption at 200 °C. Reprinted from ref. 35. Copyright (2006) with permission from Elsevier.

Fig. 3