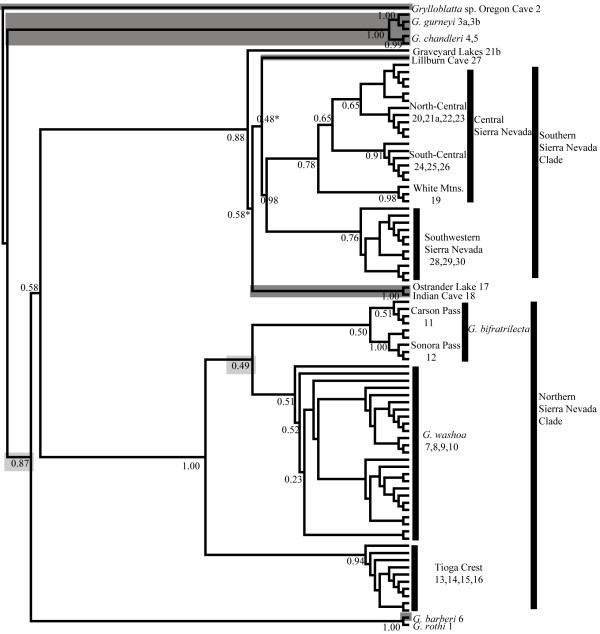
Figure 3.
Maximum likelihood phylogeny of California Grylloblatta. Maximum likelihood topology based on 1000 bootstrap replicates. Nodes conflicting with the Bayesian topology indicated by asterisks and low elevation populations indicated by shading in gray. Sample site numbers follow names at tips.

