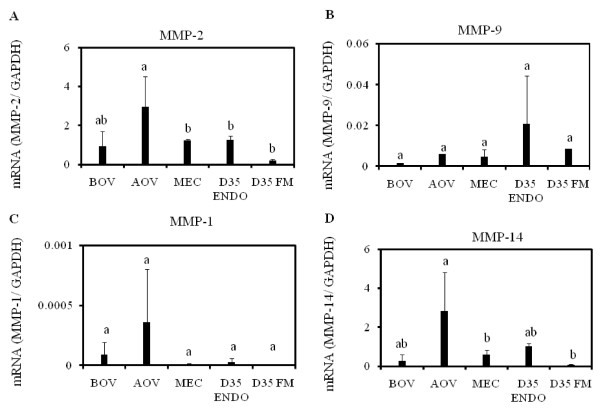
Figure 5.
Expression profile of MMP mRNA in the bovine endometrium during the estrous cycle and at Day 35 of gestation. Quantitative analysis of MMP mRNA was performed by qPCR and normalized to the expression of GAPDH mRNA. MMP-2 mRNA (A), MMP-9 mRNA (B), MMP-1 mRNA (C), and MMP-14 mRNA (D). Bar graph showing the mean ± SD. Data labeled with different letters are significantly different from each other (P < 0.05). Abbreviations are same as Figure 1.

