
Fig. 7.
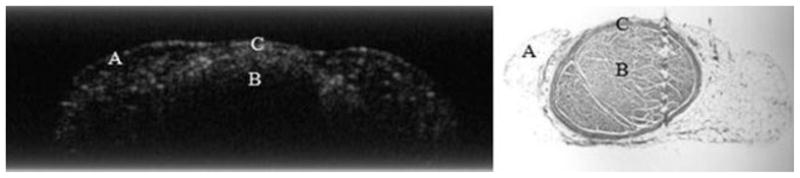
The OCT image on the left correlates with the histology section (right) of an injured sciatic nerve. Region “A” highlights connective tissue and “B” signifies nerve fascicle. “C” identifies nerve perineurium (original magnification 6.5×).
Official websites use .gov
A
.gov website belongs to an official
government organization in the United States.
Secure .gov websites use HTTPS
A lock (
) or https:// means you've safely
connected to the .gov website. Share sensitive
information only on official, secure websites.
The OCT image on the left correlates with the histology section (right) of an injured sciatic nerve. Region “A” highlights connective tissue and “B” signifies nerve fascicle. “C” identifies nerve perineurium (original magnification 6.5×).