
Figure 3.
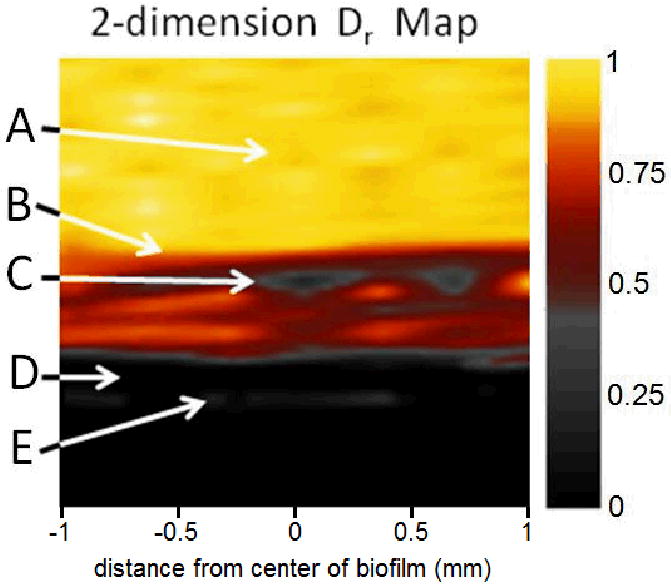
2D relative effective diffusion coefficient (Dr) map of the NMR biofilm reactor obtained by PFG-NMR. The central 2 mm of the 10-day-old biofilm are shown. A) The bulk liquid (yellow) flowing above the biofilm, B) the top of the biofilm (yellow/red interface), C) a low-diffusion region in the biofilm (gray), D) the coverslip that supports the biofilm (black), and E) a thin layer of water trapped between the coverslip and the reactor door.