
Fig. 5.
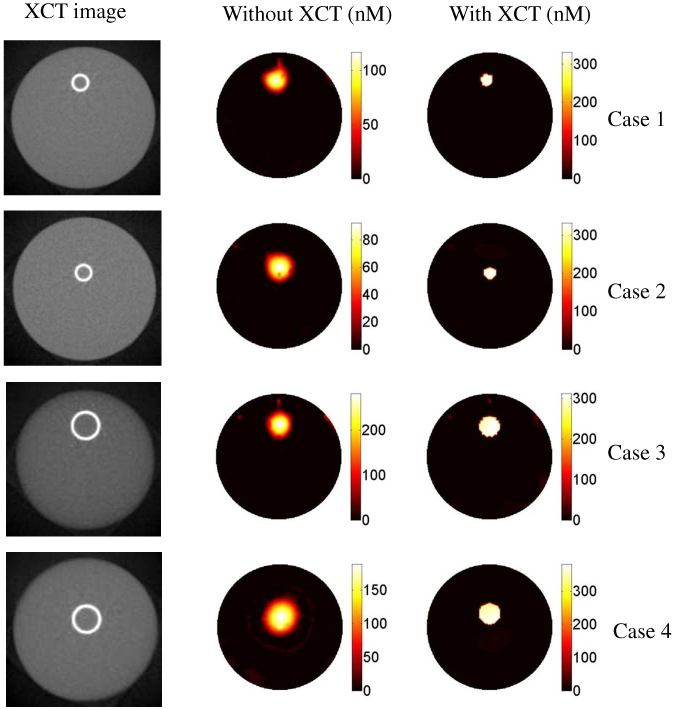
The results for the second phantom study. The first column is the XCT trans-axial images of the phantoms. The size and location of the inclusion are different for each case. The second the third columns are the reconstructed ICG concentration maps without and with the XCT structural a priori information, respectively. As seen in the images, the recovered ICG concentration value depends drastically on the size and location of the inclusion. However, the true value can be recovered for all four cases when XCT structural a priori information is used. The color bars all have the units of nM.