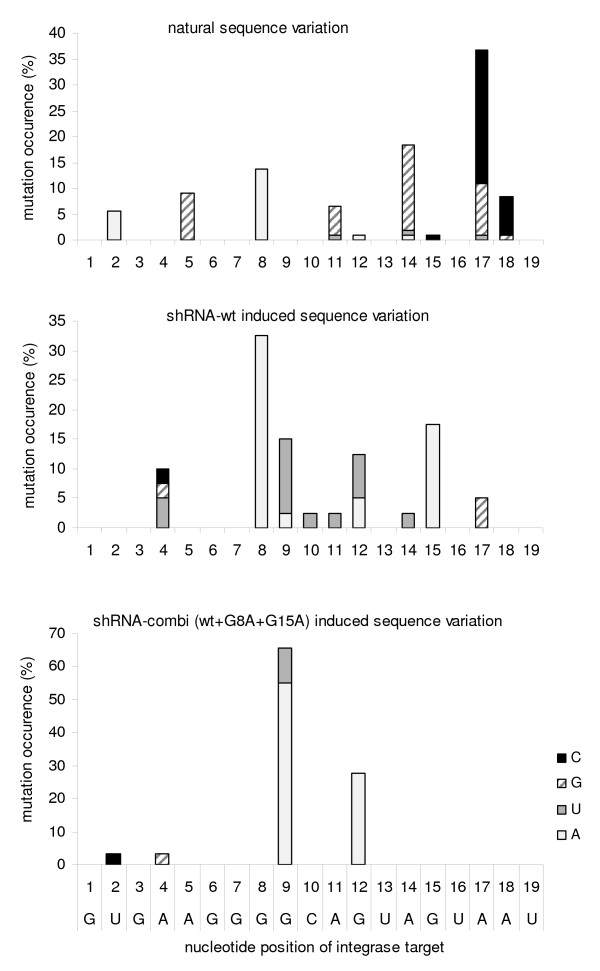
Figure 7.
Sequence variation in the integrase target region. The natural variation of HIV-1 in the target region (upper panel) is compared with the sequence variation under RNAi pressure by a single shRNA-wt (middle panel) or the shRNA-combi (wt+G8A+G12A) (lower panel). The natural sequence variation was derived from the Los Alamos HIV-1 database. Each bar represents the frequency that the mutation occurs at the indicated position.

