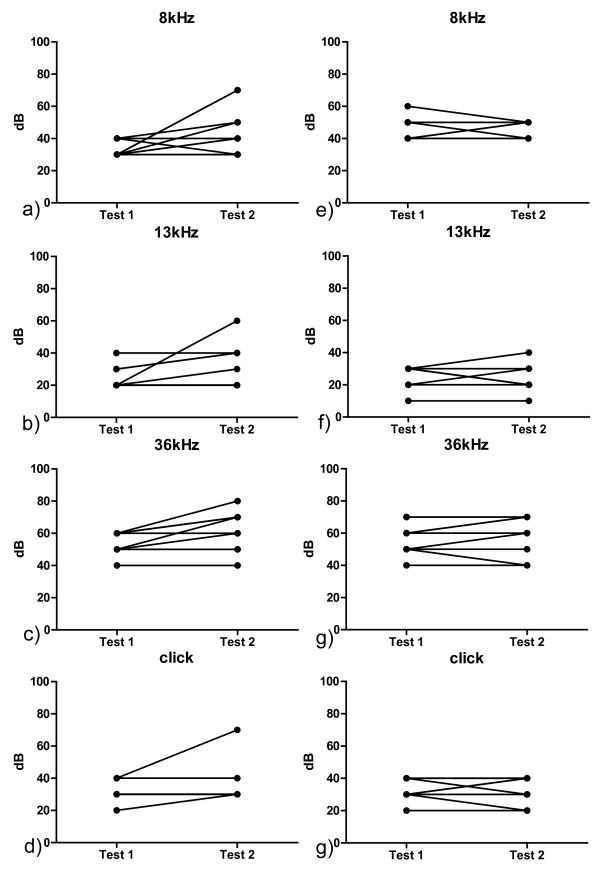
Figure 2.
shows the audiologic results of the CM group and the healthy control group. a-d) represent the CM group. Test 1 is done at baseline screening. Test two at the peak of the clinical disease. e-f) list the findings of the control group. Test 1 is done at baseline screening. Test two at the 11th day after the primary testing.

