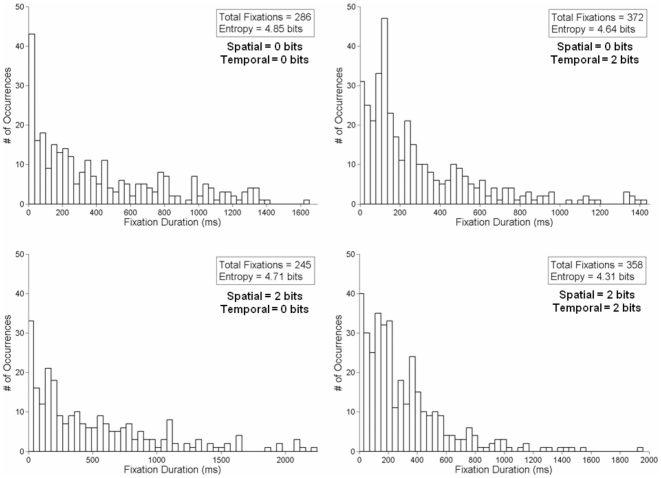
Figure 3. Exemplar probability distributions of fixation duration data.
These data are from the same subject and conditions in Figure 2. Here, the total number of fixations within each trial block is presented alongside the entropy values, calculated using Eq. 1.

