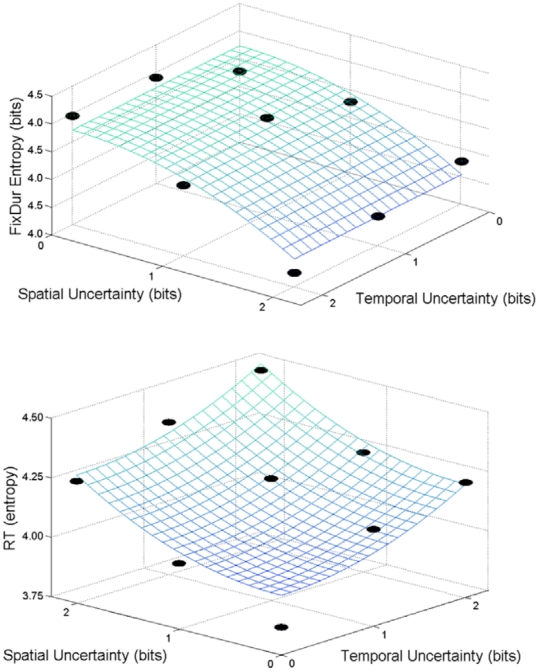
Figure 4. Results of the least-squares regression.
Quadratic surfaces generated from the coefficients obtained from the least-squares regressions (Eq. 2 and 3), where eye fixation duration and RT entropy are presented as a function of the spatial and temporal uncertainty of the visual stimulus. Upper panel presents the surface obtained from the least squares fit to the eye fixation duration entropy data. Lower panel presents the results of the least squares fit to the RT entropy data.

