
Figure 1. Overview of the household infection data.
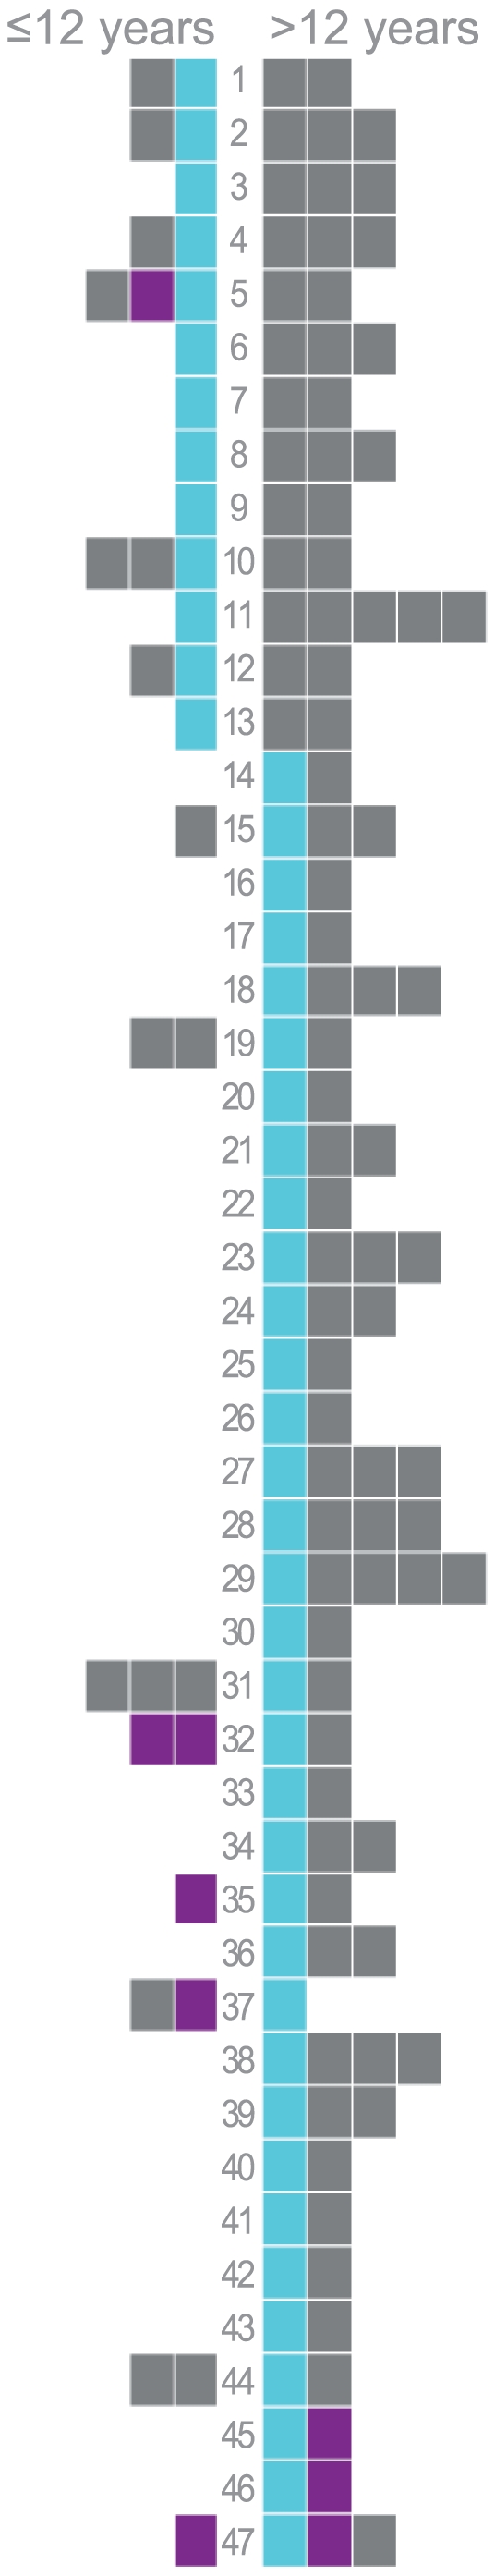
Household data were collected during the initial phase of the novel influenza A(H1N1) epidemic in the Netherlands. All household members, including the index case, were given oseltamivir upon detection of the index case. Each row represents a household and each square represents a person. Grey squares denote persons that are not infected, cyan squares correspond to index cases, and purple squares represent infected household members. Households are numbered 1 through 47. A distinction is made between younger persons (≤12 years of age, left of the household number) and older persons (>12 years of age, right of the household number).