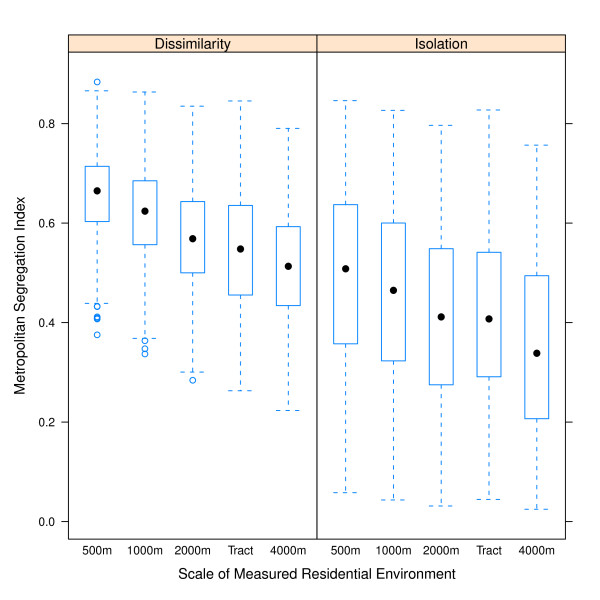
Figure 1.
Distribution of MSA residential segregation measured with five definitions of neighborhood environment. Median value indicated by filled black dot, 25th and 75th percentile indicated by the lower and upper ends of the box, whiskers are 1.5 times the inter-quartile range, and outliers are hollow dots beyond whiskers.

