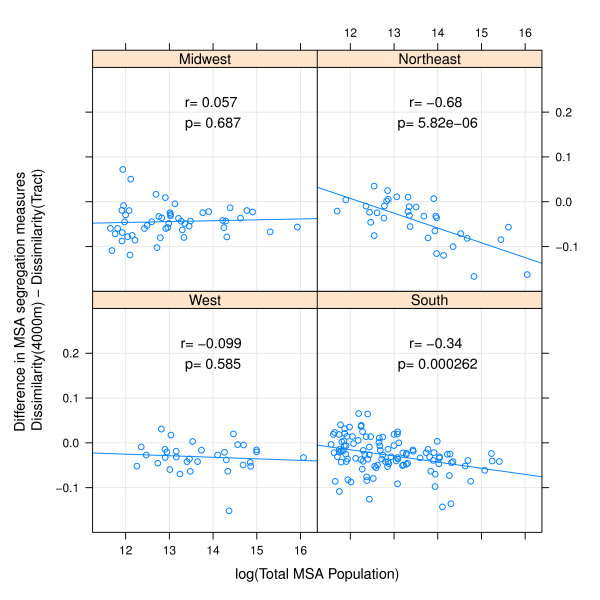
Figure 5.
Difference in MSA dissimilarity index when measured using 4000 m-egocentric neighborhood versus census tract by region. The arithmetic difference of MSA segregation calculated with 4000-meter bandwidth surface-density-derived dissimilarity index as compared with census-tract derived dissimilarity is plotted on the y-axis; log of MSA total population count in 2000 is plotted on x-axis. Pearson correlation coefficient is 'r', and corresponding p-value. Line is best fit linear regression. Panels represent MSA's within each of four census regions.

