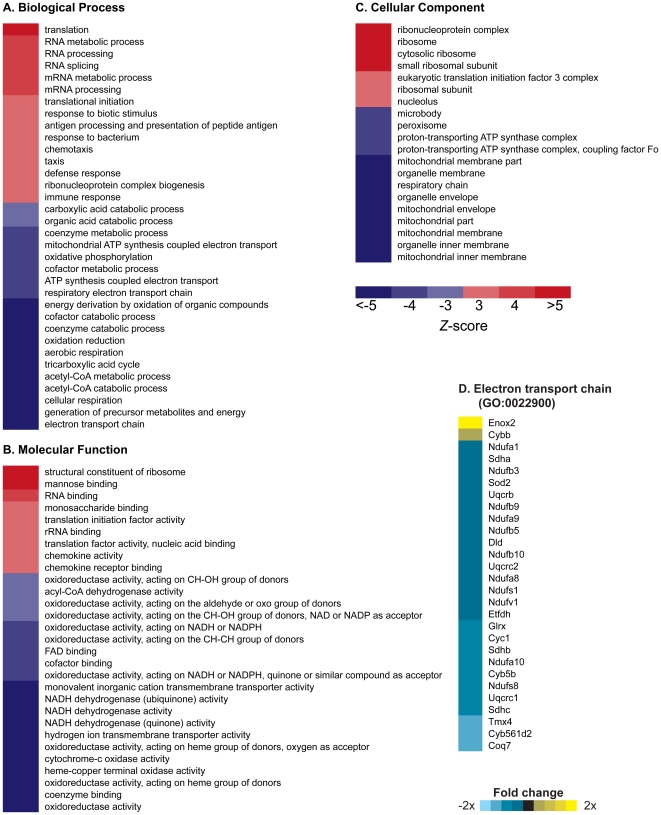
Figure 2. Parametric Analysis of Gene Set Enrichment identifies Gene Ontology (GO) terms changed in gastrocnemius muscle of 13-month old D257A mice as compared to 13-month old WT mice.
(A, B, C) Terms shown are those significantly changed (p<0.01, FDR<0.01). Red indicates a GO term that was induced by mtDNA mutations (Z-score>0); blue indicates GO terms that were suppressed by mtDNA mutations (Z-score<0). n = 5 mice per group. (D) Genes listed within the GO term “electron transport chain” (Z-score = −8.89; p<0.0001) whose expression level significantly (p<0.01) increased (yellow) or decreased (blue) in D257A mice.

