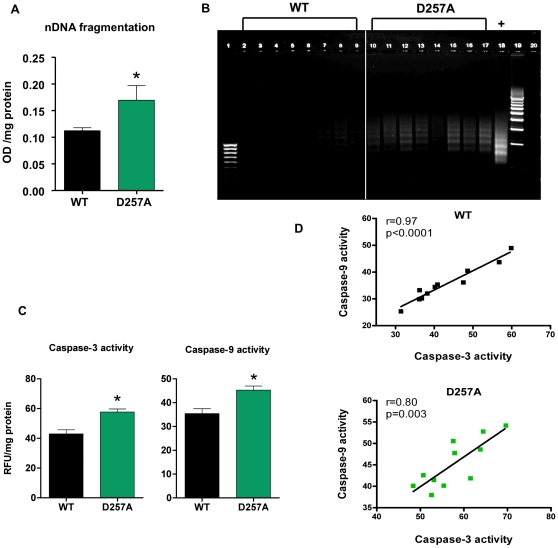
Figure 10. Apoptosis is evident in D257A muscle by increased cytosolic DNA fragments, DNA laddering, and caspase activation.
(A) Cytosolic fractions from 11-mo old WT and D257A skeletal muscle (n = 11 per group) were prepared. Nuclear DNA fragmentation was quantified as the amount of mono- and oligo-nucleosomes present in the cytosol, using a sandwich ELISA. Mean values ±SEM are shown. *p<0.05. OD: optical density. (B) DNA from 13-mo old WT and D257A (n = 8 per group) mice was extracted and subjected to a DNA laddering-specific ligation PCR. PCR products were electrophoresed through 1% agarose gels and visualized under UV light for apoptosis-specific DNA ladders of ∼180–200 bp multiples. Lane 1: 100 bp molecular marker. Lanes 2–9: WT PCR products. Lanes 10–17: D257A PCR products. Lane 18: Positive control. Lane 19: 500 bp molecular marker. (C) Cytosolic fractions from 11-mo old WT and D257A skeletal muscle (n = 11 per group) were prepared. Caspase -3 and -9 activities were measured using a fluorometric protease assay kit which is based on detection of cleavage of the substrates DEVD-AFC or LEHD-AFC by caspase-3 and -9 respectively. Mean values ±SEM are shown. *p<0.002. RFU: raw fluorescent units. (D) Caspase-3 activity was correlated with caspase-9 activity in WT and D257A mice (n = 11 per group). Pearson correlation r values are shown in the top right corner. Correlations were significant for both genotypes; WT: r = 0.97, p<0.0001 and D257A: r = 0.8, p<0.003.

