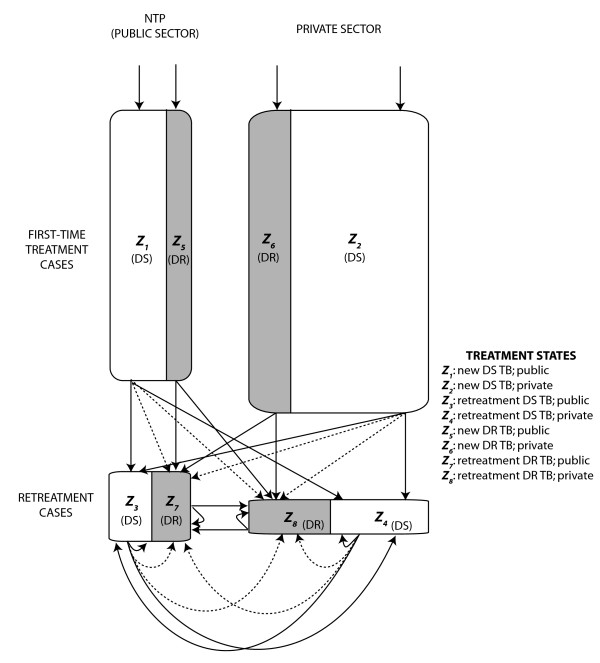
Figure 1.
Model structure. The model simultaneously distinguishes new TB cases (Z1, Z2, Z5, Z6) from retreatment TB cases (Z3, Z4, Z7, Z8) and characterizes the sector of presentation (public = Zodd; private = Zeven) and the drug resistance phenotype (sensitive = Z≤4; resistant = Z>4). Shaded areas represent classes of drug resistant disease while white areas represent classes of drug sensitive disease. The equations that describe transitions between states are provided in the text. The dotted arrows represent the acquisition of drug resistance from one treatment episode to the next.

