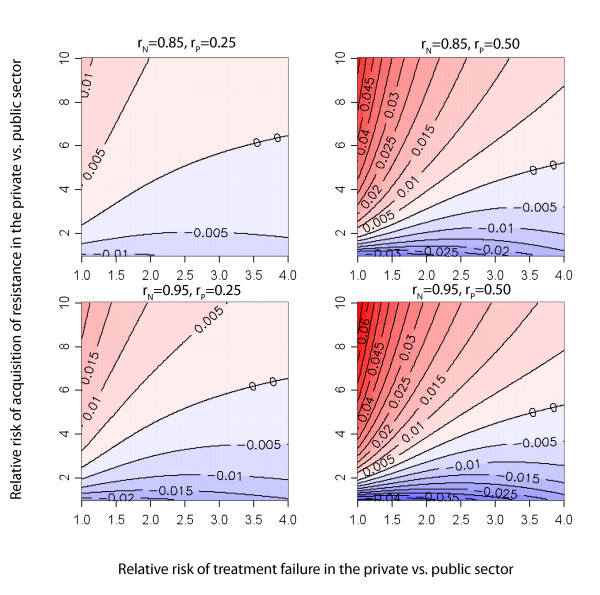
Figure 3.
Bias in retreatment cases. Percent bias in retreatment cases as a function of the relative risk of acquired drug resistance and relative risk of failure in the private sector. Blue represents parameter space in which public sector surveys overestimate total resistance and red represents parameter space in which public sector surveys underestimate total resistance; more saturated colors indicate greater bias. The values on the lines indicate percent bias. Results present values at equilibrium with aN = 0.1; aP allowed to vary; fSN = 0.1; fSP allowed to vary; fRN = 0.25; fRP allowed to vary; l = 0.2; q = 0.6; xR = 0.2; xS = 0.2. The panels represent four different scenarios of patient preference for retreatment in public or private sector.

