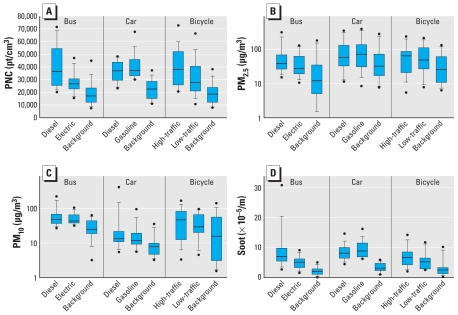
Figure 4.
Exposures in modes of transport and at the urban background location on corresponding sampling days. (A) Two-hour average PNCs (particles/cm3). Two-hour average PM2.5 (B), PM10 (C), and soot (D; fraction of PM10). Box-and-whisker plots indicate lower and upper quartiles (box), median (line), 10–90th percentiles (whiskers), and minimum and maximum values (circles).

