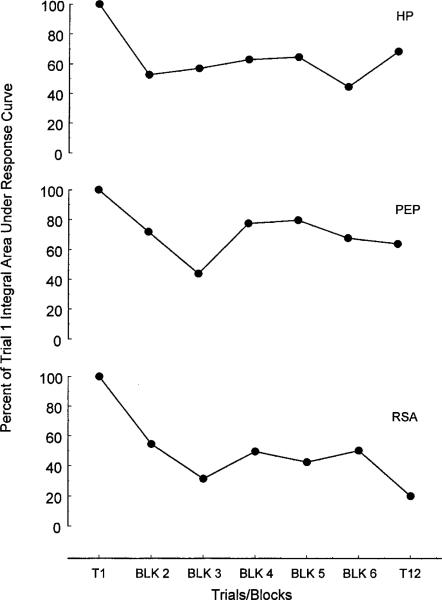
Figure 3.
Change in the amplitude of heart period (upper panel), preejection period (middle panel), and respiratory sinus arrhythmia (bottom panel) responses to pure tone stimuli. Response amplitude represents the percent of Trial 1 integral area under the poststimulus response curve for each measure.

