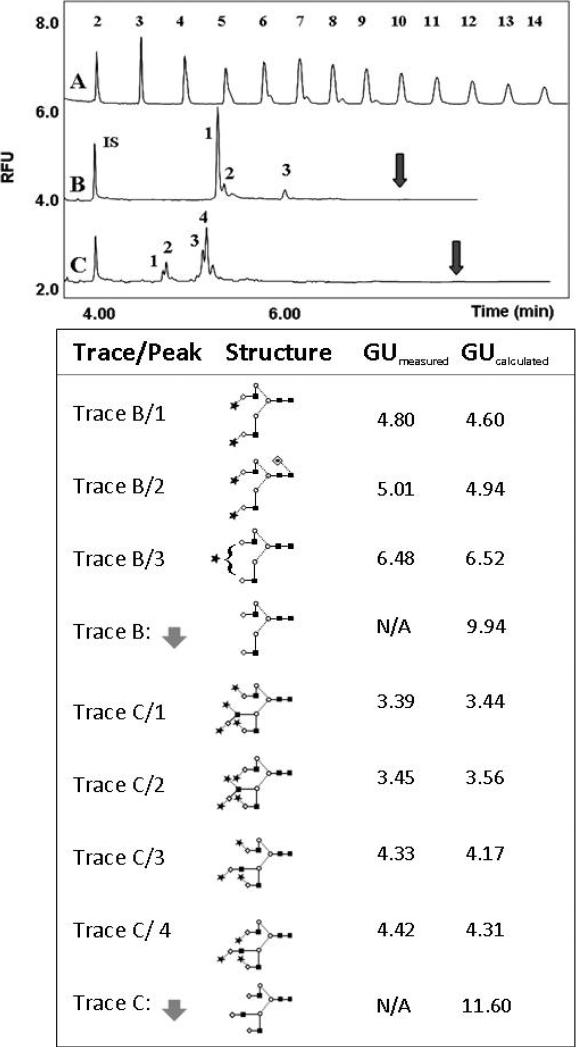
Figure 2.
Comparative CE-LIF analysis of APTS labeled released glycans from human transferrin (upper panel). The lower panel shows the structures and GU values of all the glycans corresponding to the numbered peaks in the upper panel (trace B, peaks 1-3 and trace C, peaks 1-4). The arrows in the upper panel depict the calculated migration position of the desialylated transferrin (trace B) and fetuin (trace C) glycans. IS (internal standard): APTS derivatized maltose. GUmeas and GUcalc are the measured and calculated glucose unit values, respectively. Symbols: ■ GlcNac; ○ Man; ◇ Gal; * Neu5Ac, – β linkage; ... α linkage. All separations were carried out in a PVA coated capillary (effective length: 40 cm, i.d.: 50 μm) at ambient temperature in 25 mM acetate (pH 4.75) buffer applying 250 V/cm field strength. Injection: hydrostatic, Δ 10 cm/10 sec.

