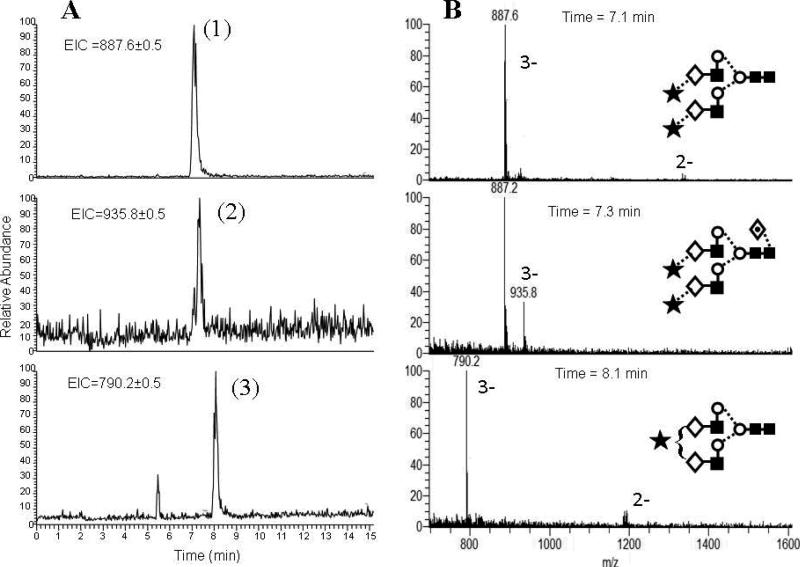
Figure 3.
CE-MS extracted ion electropherograms of APTS-labeled transferrin glycans (panel A) and the MS traces of the corresponding major peaks (panel B). Symbols are the same as in Figure 2. Conditions: Separation field strength: 250 V/cm; 15 mM acetate buffer (pH 4.75), ambient temperature. Injection: -5 kV / 15 seconds. ESI voltage: -1.8 kV.

