
Figure 5. DHHC proteins localized to the Golgi.
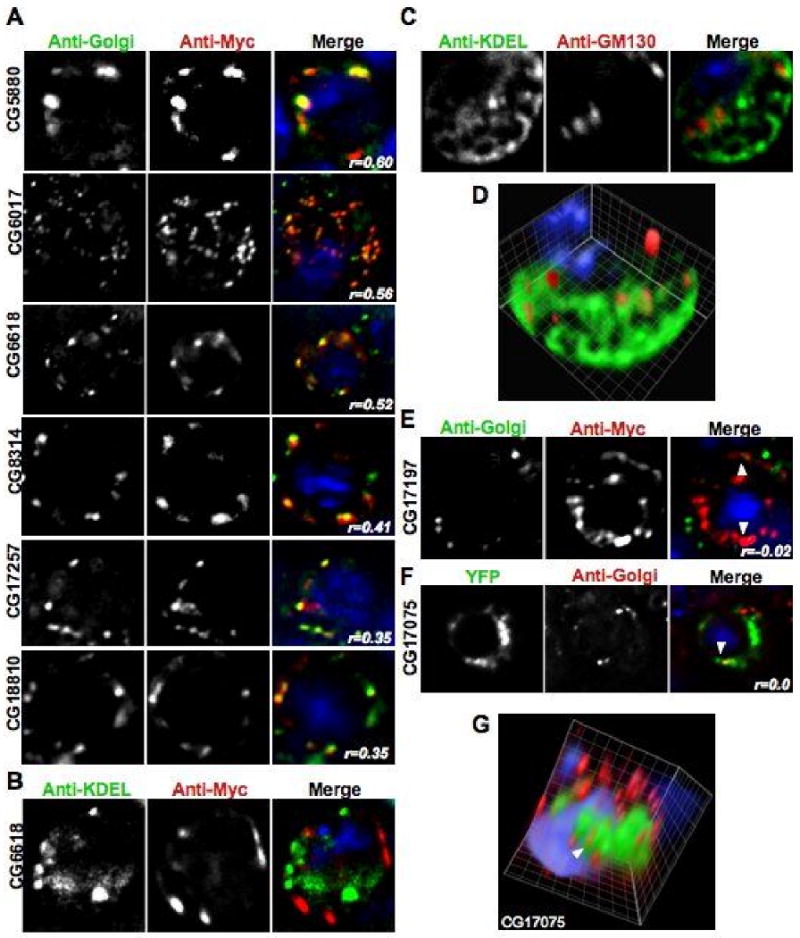
All of the panels show images acquired in each channel and then a merged view. The blue DAPI stain is only shown in the merged view. Unless otherwise noted, the images shown are one section of a deconvolved Z-stack through the cell. A. Representative images of transiently transfected S2 cells that were triple stained with DAPI, anti-Myc, and an anti-Golgi antibody. The Pearson's Correlation statistic (r) for the pixel intensity correlation between the red Myc channel and the anti-Golgi green channel is shown in the merge panel. B. A representative image of a transiently transfected S2 cell that was triple stained with DAPI, anti-Myc, and an anti-KDEL antibody showing a lack of co-localization between CG6618 and the ER marker. C. A representative image of an untransfected S2 cell that was triple stained with DAPI, the cis Golgi marker anti-GM130, and an anti-KDEL antibody showing that the Golgi and ER compartments can be visually separated in S2 cells. D. A volume view produced from a deconvolved Z-stack of the cell shown in C that shows compartment separation in a single S2 cell. E. A representative image of a S2 cell transiently transfected with a CG17197-6×Myc construct. The cell was triple stained with DAPI, an anti-Golgi antibody, and anti-Myc antibody to show that the ER-localized CG17197 is distinct from the anti-Golgi marker. Arrowheads label areas of close association of the two signals. F. A representative image of a S2 cell transiently transfected with a CG17075-YFP construct. The cell was stained with DAPI, and an anti-Golgi antibody to show that the ER-localized CG17075 is distinct from the anti-Golgi marker. An arrowhead labels an area of close association of the two signals. G. A volume view produced from a deconvolved Z-stack of the cell shown in F. An arrowhead labels the same area of close association that is shown in panel F. The volume reconstruction demonstrates that the Golgi signal is distinct from the ER-localized CG17075-YFP protein.