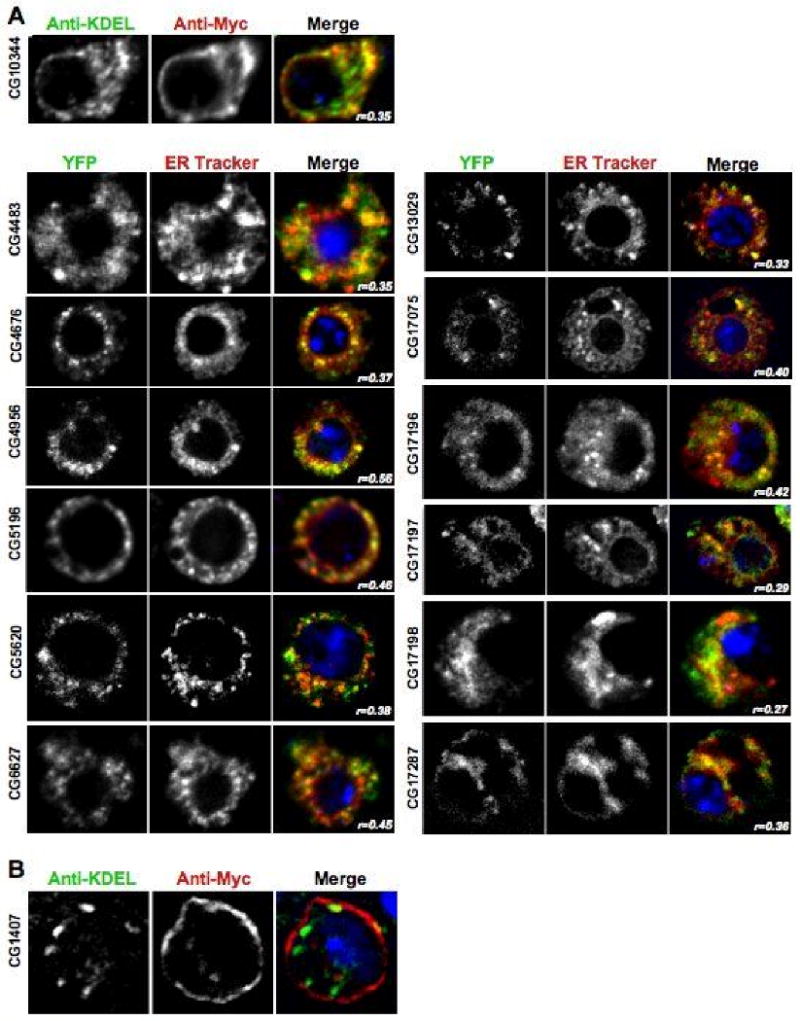
Figure 6. DHHC proteins localized to the ER and the Plasma Membrane.

A. Representative images of transiently transfected S2 cells that were triple stained with DAPI, anti-Myc, and an anti-KDEL antibody or cells imaged with DAPI, YFP, and ER-Tracker Red. The panel for each DHHC gene shows the image acquired in each channel and then a merged view. The blue DAPI stain is only shown in the merged view. The images shown are one section of a deconvolved Z-stack through the cell. The Pearson's Correlation statistic (r) for the pixel intensity correlation between the green channel and the red channel is shown in the merge panel. B. Representative image of a S2 cell transiently transfected with a CG1407-6×Myc construct that was triple stained with DAPI, anti-Myc, and an anti-KDEL antibody to demonstrate the plasma membrane localization of the protein. The panel shows the image acquired in each channel and then a merged view. The blue DAPI stain is only shown in the merged view. The image shows one section of a deconvolved Z-stack through the cell.
