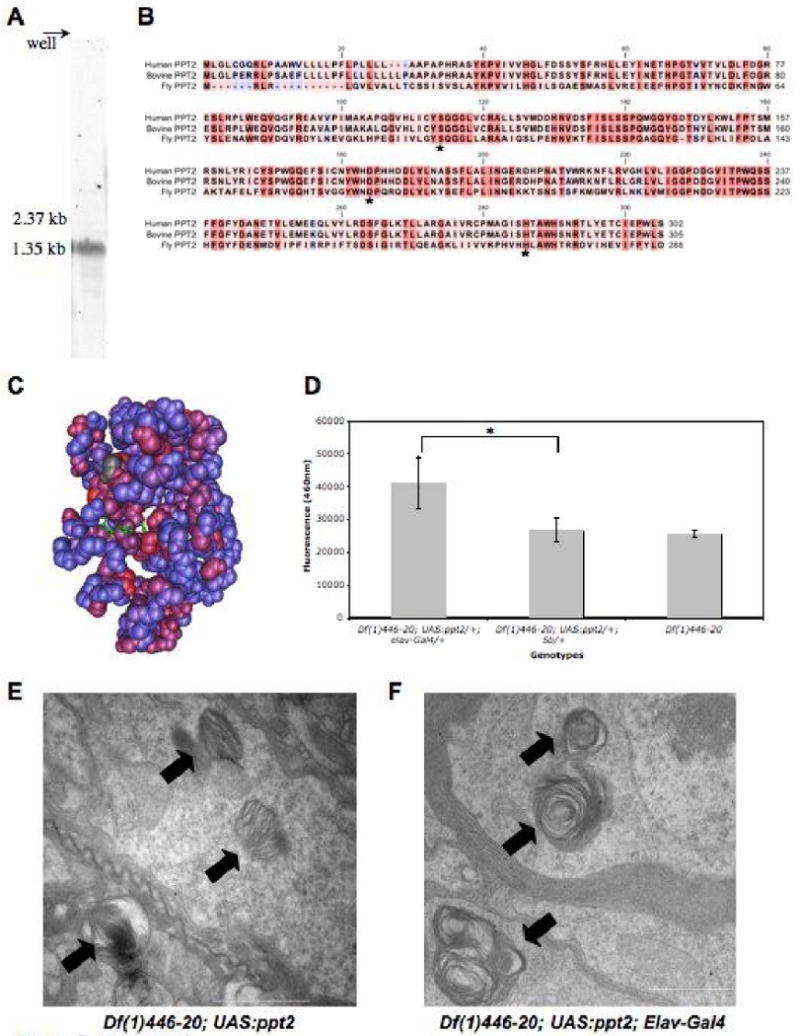
Figure 7. The Drosophila PPT2 homolog.

A. A northern blot of adult total RNA showing the ∼1.5kb transcript highlighted by a Ppt2 specific riboprobe. B. Sequence alignment of human, bovine, and fly PPT2 amino acid sequence generated with ClustalX. The amino acid residue's background color indicates the degree of conservation between the proteins: red is highly conserved and blue indicates no conservation. The conserved catalytic triad is indicated with an asterisk. C. Drosophila sequence conservation was mapped onto the PPT2 bovine crystal structure using Cn3D (NCBI). The crystal structure shows conserved regions in red, non-conserved regions in blue, and the conserved catalytic triad in green. D. A graph demonstrating that Ppt2 over-expression in a Ppt1 null background produces significant (*=p<0.0002, t-test) cleavage activity of the PPT1 substrate, 4MU-6S-palm-β-Glc. PPT2 enzyme activity was measured as the mean total fluorescence emitted at 460nm per head.E. Transmission electron micrograph (TEM) image of a Df(1)446-20; UAS:ppt2/+ brain showing inclusions of abnormal storage material. Laminar deposits typical of Ppt1 mutants are indicated with an arrow. F. TEM images of Df(1)446-20; UAS:ppt2/+; Elav-Gal4/+ brains show similar deposits (arrows). Scale bars are 1μm.
