
Figure 8. Expression and localization of the Drosophila thioesterases, Ppt1 and Ppt2.
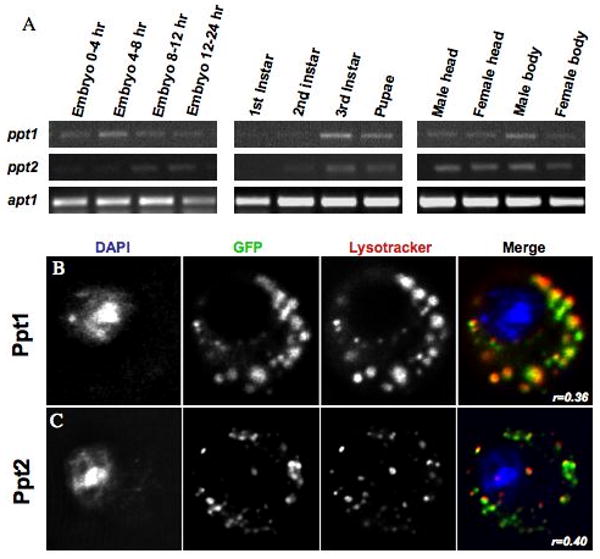
A. Thioesterase developmental expression levels were assayed using gene-specific PCR primers on a panel of first-strand cDNA prepared from 12 Drosophila tissues and developmental stages. B. Live cell imaging of an S2 cell transiently transfected with a GFP-Ppt1 fusion protein. Cells were co-stained with Lysotracker-red and DAPI. C. Live cell imaging of an S2 cell transiently transfected with a Ppt2-YFP fusion protein. Cells were co-stained with Lysotracker-red and DAPI. The Pearson's Correlation statistic (r) for the pixel intensity correlation between the GFP channel and the Lysotracker Red channel is shown in the merge panel.