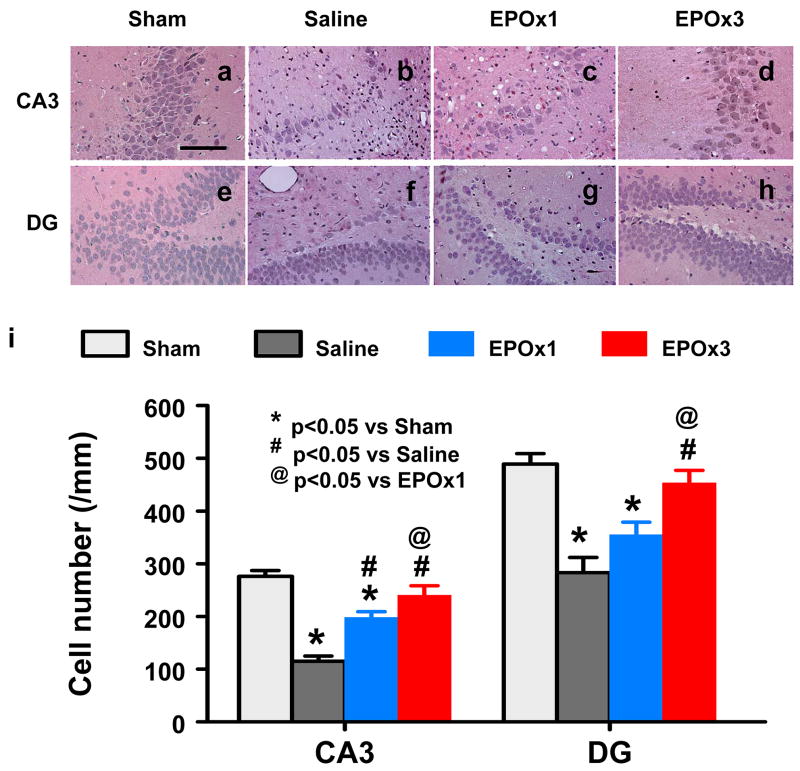
Fig. 6.
Effect of EPO on cell loss in the ipsilateral DG and CA3 region at 35 days after TBI. H&E staining: a–h. Delayed treatment with EPOx1 (c, g) and EPOx3 (d, h) significantly reduced cell loss as compared with the saline group (b, f) (p < 0.05). As compared to EPOx1 group, the cell number in the EPOx3 group was significantly higher (p < 0.05). The cell number in the DG and CA3 region is shown in (i). Data represent mean ± SD. Scale bar = 50μm (a–h). *p < 0.05 vs. corresponding sham. #p < 0.05 vs. the saline group. @ p < 0.05 vs EPOx1 group. N (rats/group) = 6 (Sham); 6 (Saline); 6 (EPOx1); 7 (EPOx3).

