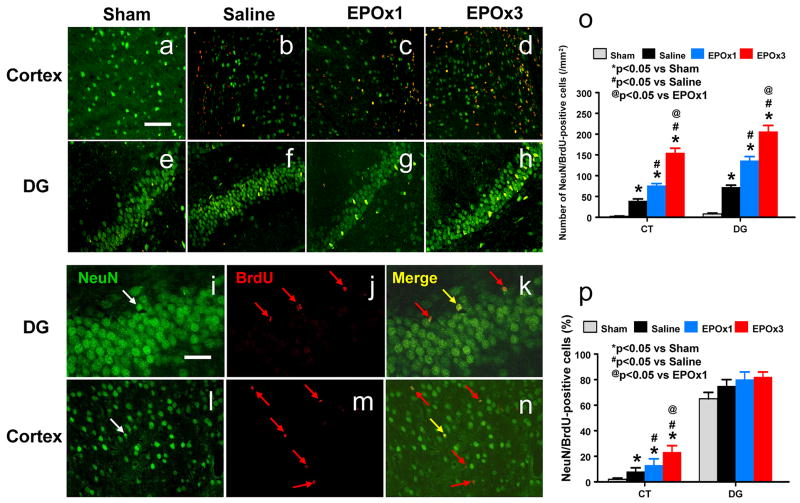
Fig. 9.
Double fluorescent staining for BrdU (red) and NeuN (green) to identify newborn neurons (yellow after merge, k and n) in the injured cortex (a-d) and the ipsilateral DG (e-h) at 35 days after TBI (b, f) and EPO treatment (c, d, g, and h). Newborn BrdU-positive cells (red, j and m) differentiate into neurons expressing NeuN (yellow, k and n). The total number and percentage of NeuN/BrdU-colabeled cells are shown in (o) and (p), respectively. Data represent mean ± SD. Scale bars = 50 μm (a); 25 μm (i). *p < 0.05 vs. corresponding sham. #p < 0.05 vs. the saline group. @ p < 0.05 vs EPOx1 group. N (rats/group) = 6 (Sham); 6 (Saline); 6 (EPOx1); 7 (EPOx3).

