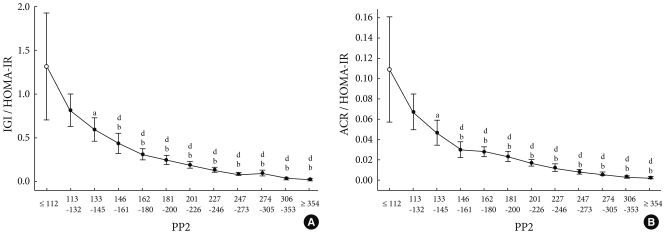
Fig. 2.
Relationship between postprandial plasma glucose and early phase insulin secretion. Data represents means and 95% confidence intervals. IGI, insulinogenic index; HOMA-IR, homeostasis model assessment-insulin resistance; ACR, acute C-peptide response. aRefers to P < 0.05 vs. P1 (PP2 < 112 mg/dL), bP < 0.01 vs. P1, cP < 0.05 vs. P2 (PP2 113-132 mg/dL), dP < 0.01 vs. P2.

