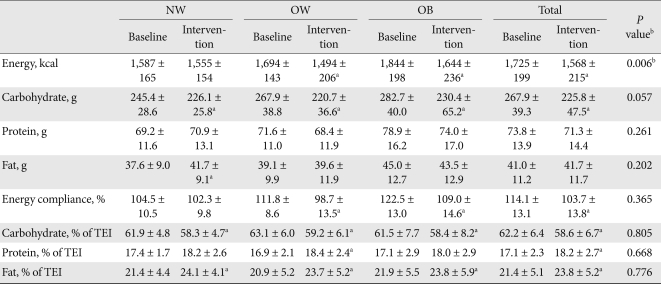
Table 2.
Dietary energy intake and amount and proportion of macronutrients in study subjects
The values were presented as mean ± standard deviation. Dietary energy compliance was total daily energy intake (kcal) / prescribed energy intake (kcal) × 100.
NW, normal weight; OB, obese; OW, overweight; TEI, total energy intake.
aP values < 0.05 for comparison between baseline and intervention, bP values < 0.05 for comparison groups.

