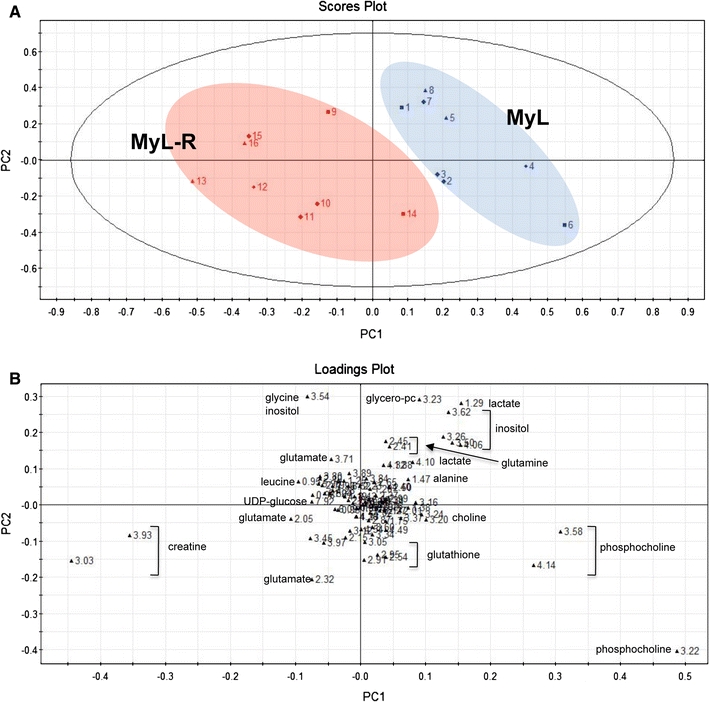
Fig. 3.

Metabolic distinction of MyL from MyL-R cells. a Scores plot (PC1/PC2) based on 1H NMR spectra of cell extracts from MyL and MyL-R cells grown in the absence of imatinib. b Corresponding loadings plot. Values given correspond to chemical shift values (ppm) from 1H spectra (n = 8)
