
Fig. 1.
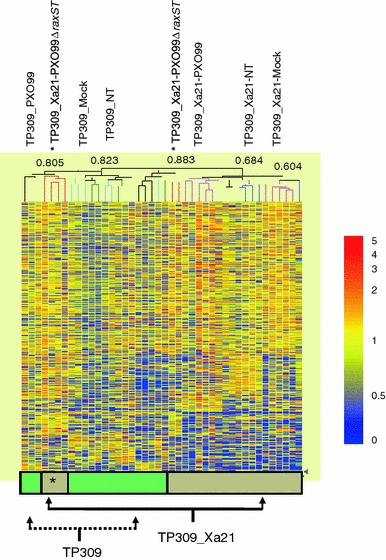
Hierarchical cluster analysis of LC–TOF (+) data of six biological replicates for the seven rice genotype/infection classes. The mass trees (dendrograms) reveal the relationships between the different conditions based on their abundance levels with each rectangle or cell representing an accurate mass, colored by its abundance intensities on a normalized scale from 0 (low) to 5 (high). Masses with similar abundance patterns are placed closer to each other. The mass tree branches at the top of the figure are colored by each condition, and shows the correlations for the main clades or branches. The bottom of the figure shows that the tree branches for each group of conditions are separated based on rice genotype. The * denotes four out of six Xa21-PXO99△raxST samples clustering with the TP309 genotype