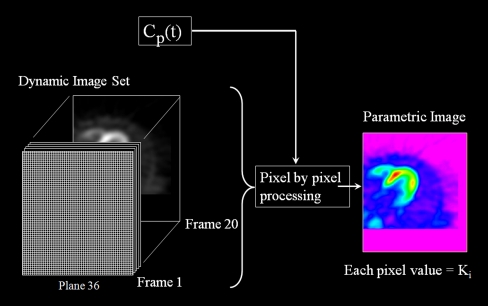
Fig. 3.
Dynamic image set of the myocardium obtained with 18F-FDG PET and the plasma–time–activity curve C p(t) are used to generate a parametric horizontal long axis image of the heart, where the value of each pixel represents the magnitude of the influx contestant K i. Pixel by pixel processing was performed using the Patlak graphical analysis

