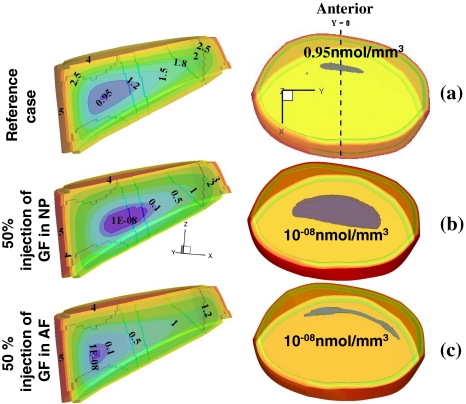
Fig. 6.
The effect of increase in cellular metabolism by 50% (simulating growth factor injection) on extreme glucose concentrations (nmol/mm3). Mid-sagittal views are shown on the left whereas on the right are the superior translucent views of the entire disc showing the glucose extreme regions in grey. a Reference case with 100% permeable CEPs, b increase in the nucleus with a 30% relative diffusivity at lower CEP, and c increase in the annulus region with a 30% relative diffusivity at lower CEP

