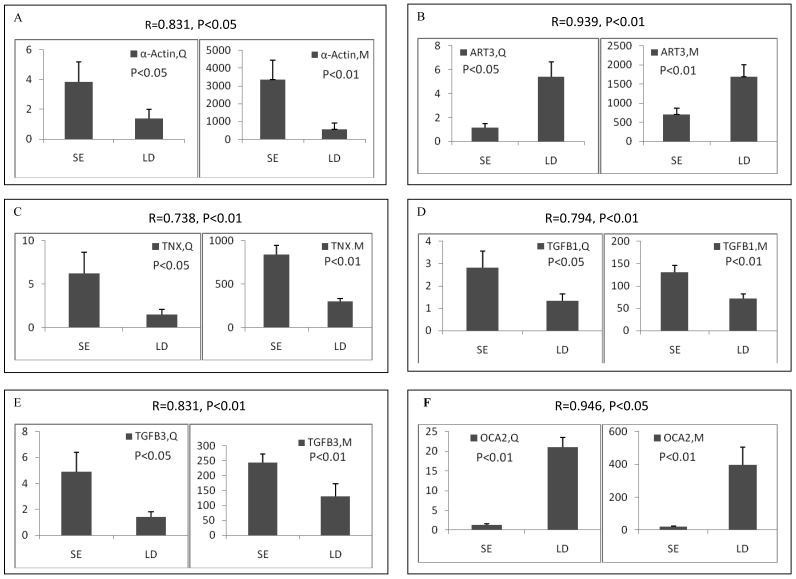
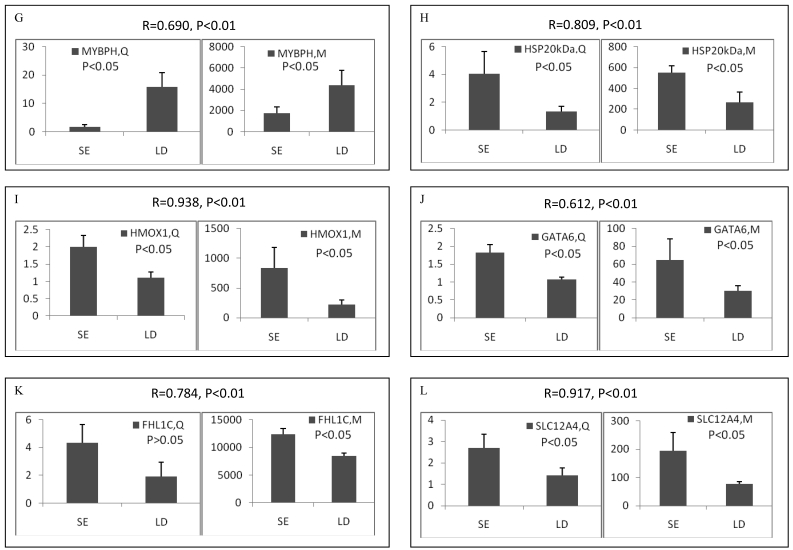
Figure 2.
Validation of differentially expressed genes between longissimus doris (LD) and soleus (SE) by qRT-PCR. The data presented in Y-axis indicated the relative mRNA expression of both microarray (M) and qRT-PCR (Q) and expressed as means of three pigs ± s.d. The correlation coefficient (R) and the corresponding significance value (P) were shown above their respective columns.


