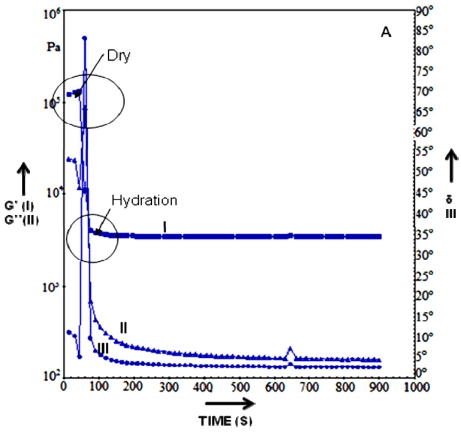
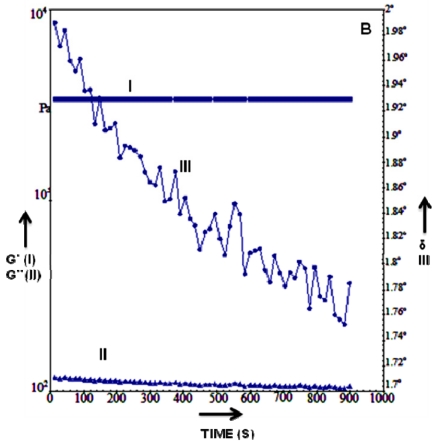
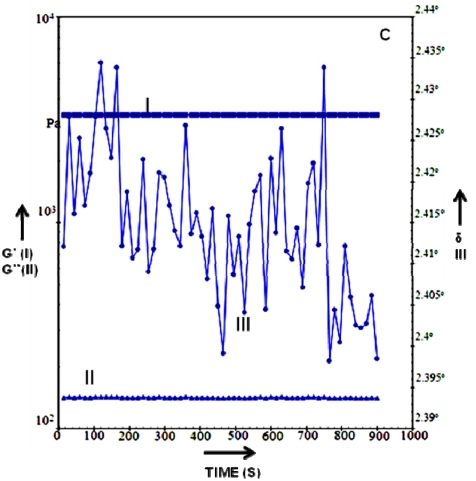
Figure 3.
Graph represents the rheology data of HG cryogels, the storage modulus, loss modulus and phase angle is plotted against the time at temperature 37 ºC in dry state (A) 37 ºC wet (B) and 25 ºC wet state (C). In the graph the storage modulus G' is represented by (I), the loss modulus G” is depicted by (II) and phase angle by δ (III).


