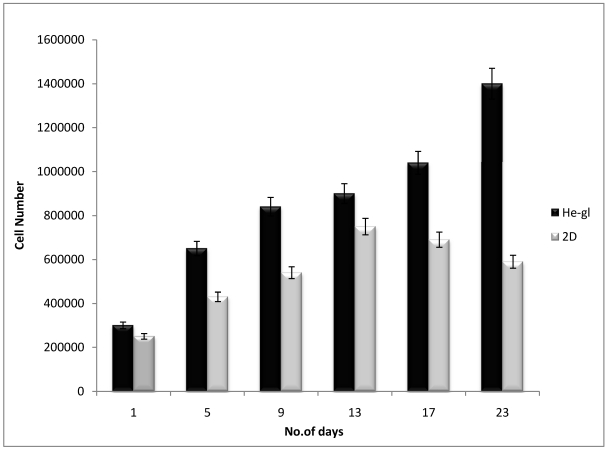
Figure 4.
The total metabolic activity of the cells was checked by alamar blue at regular time intervals. The graph describes C2C12 growth on HG cryogel (Black bar) which shows increasing trend in the metabolic activity but the 2-D culture (grey bar) starts declining from 13th day which could be due to lesser surface area available for cells after attaining confluency. The total cellular metabolic activity assay indicates the cryogels supporting the proliferation of C2C12 cells for over 3 weeks.

