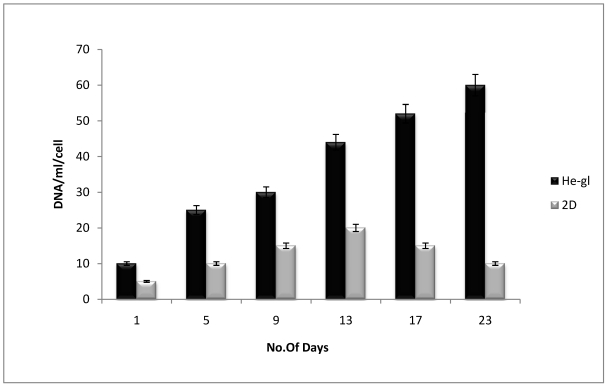
Figure 5.
The DNA quantification was done by using the Hoechst assay. The proliferative cells are analyzed for total DNA content. The standard curve was used to derive the DNA per ml of cells and further used for calculating DNA content in the test samples. Graph indicates C2C12 on the HG cryogels (Black bar) which showed improved proliferation as compared to 2-D (grey bar) which showed total DNA content increasing and these results are in accordance with the alamar blue data which shows similar trend. Since in 3-D scaffold surface area is larger in comparison to 2-D hence the better cell proliferation is noted due to increased metabolic activity of cells resulting in enhanced cell proliferation and increased DNA content.

